| epYme documentation |
|
ASM++: a modern Algorithmic State Machine methodology for RTL designs
Traditional ASM charts
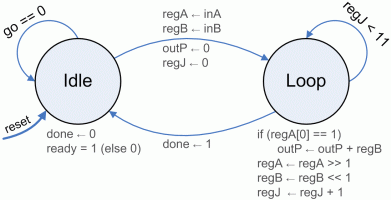
The main features of classical Algorithmic State Machines (ASM charts) can be summarized using an example, as shown at the following figures,
that describe a digital circuit that multiplies two positive 12-bit integer numbers from 'inA' and 'inB' inputs,
producing a 24-bit result at 'outP' output. At left, a Finite State Machine (FSM) shows that the product
is computed through twelve conditional additions, but involved operations must be annotated here and there; on the other hand,
at right, an ASM charts shows how operations are executed (or not) at any of its two states:
 |
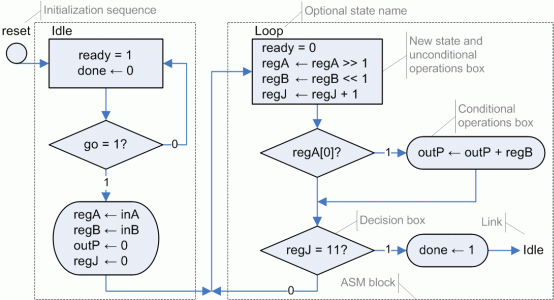 |
ASM charts are much more robust and productive than classical state machines,
because on FSM only the states and the evolution between states are properly expressed.
When using ASM charts, not only conditions are clearly expressed,
but also conditional and unconditional operations executed on each clock cycle can be specified.
Nevertheless, these classical ASM charts have several drawbacks:
- They use two different boxes to specify unconditional operations (rectangular boxes) and
conditional ones (oval boxes). This feature causes certain confusion and, actually, it limits designer choices,
who eventually desires a different order for operations to fit the functionality that he/she wishes to implement.
- The reason of the previous point is that rectangular boxes have two different meanings:
on the one hand they are used to specify unconditional operations, but simultaneously
they indicate the beginning of each state or clock cycle; because of that reason, conditional operations
cannot be expressed through rectangular boxes. An immediate consequence is that boundaries of states may
become unclear, so frequently it is necessary to use "ASM blocks", that include all the operations that
are executed during each clock cycle.
- The expressions of these charts commonly use two different assignment operands: an equal symbol ('=') means that
a signal gets a value during a clock cycle; an arrow or delay operator means that a signal
will get a value at the end of a clock cycle, storing that value for future use. The former leads
to combinational logic while the later requires DFFs to store and synchronize the results. However,
designers must read the content of each box in order to understand these two different behaviors.
- At last, classical ASM charts do not define accurately how to describe several design specifications:
for example, it is not possible to give a name to the design, they cannot specify the names and widths of its
internal or external signals, their values after each initialization sequence or which signal will be
used for synchronization. All these characteristics are usually written down using annotations,
thus these diagrams are only a sort of help for designers, like traditional state machines,
but they cannot be considered as tool to fully describe digital circuits.
Index · Previous: Introduction · Next: A proposal for ASM++ charts
|
|